Documentation Index
Fetch the complete documentation index at: https://docs.gp.scale.com/llms.txt
Use this file to discover all available pages before exploring further.
Using Sample Data: The examples on this page use fields from our sample dataset. Download it and create an evaluation with it to follow along with this tutorial.
When to Use
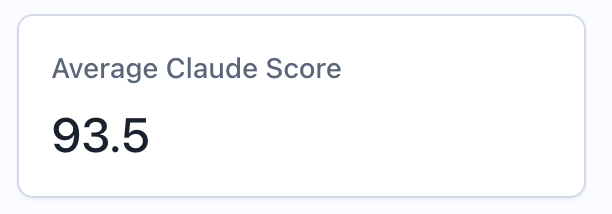
Use metric widgets to:- Display top-level aggregation values (e.g., “Average Model Score: 0.87”)
- Show summary statistics (e.g., “Total Items: 1,247”)
- Highlight key thresholds (e.g., “95th Percentile Latency: 234ms”)
- Create metric cards for at-a-glance monitoring
- Track pass rates and percentages
Configuration
Required Fields
Widget display name shown on the dashboard
Must be set to “metric”
MetricQuery with exactly one aggregation function
Query Requirements
Metric widgets require a MetricQuery with these constraints:- Must have exactly one item in the
selectclause - That item must be an
AGGREGATIONexpression (not a raw column) - Can optionally include
filterconditions - Cannot use
groupBy,orderBy, orlimit
Creating in the UI
Configure Query
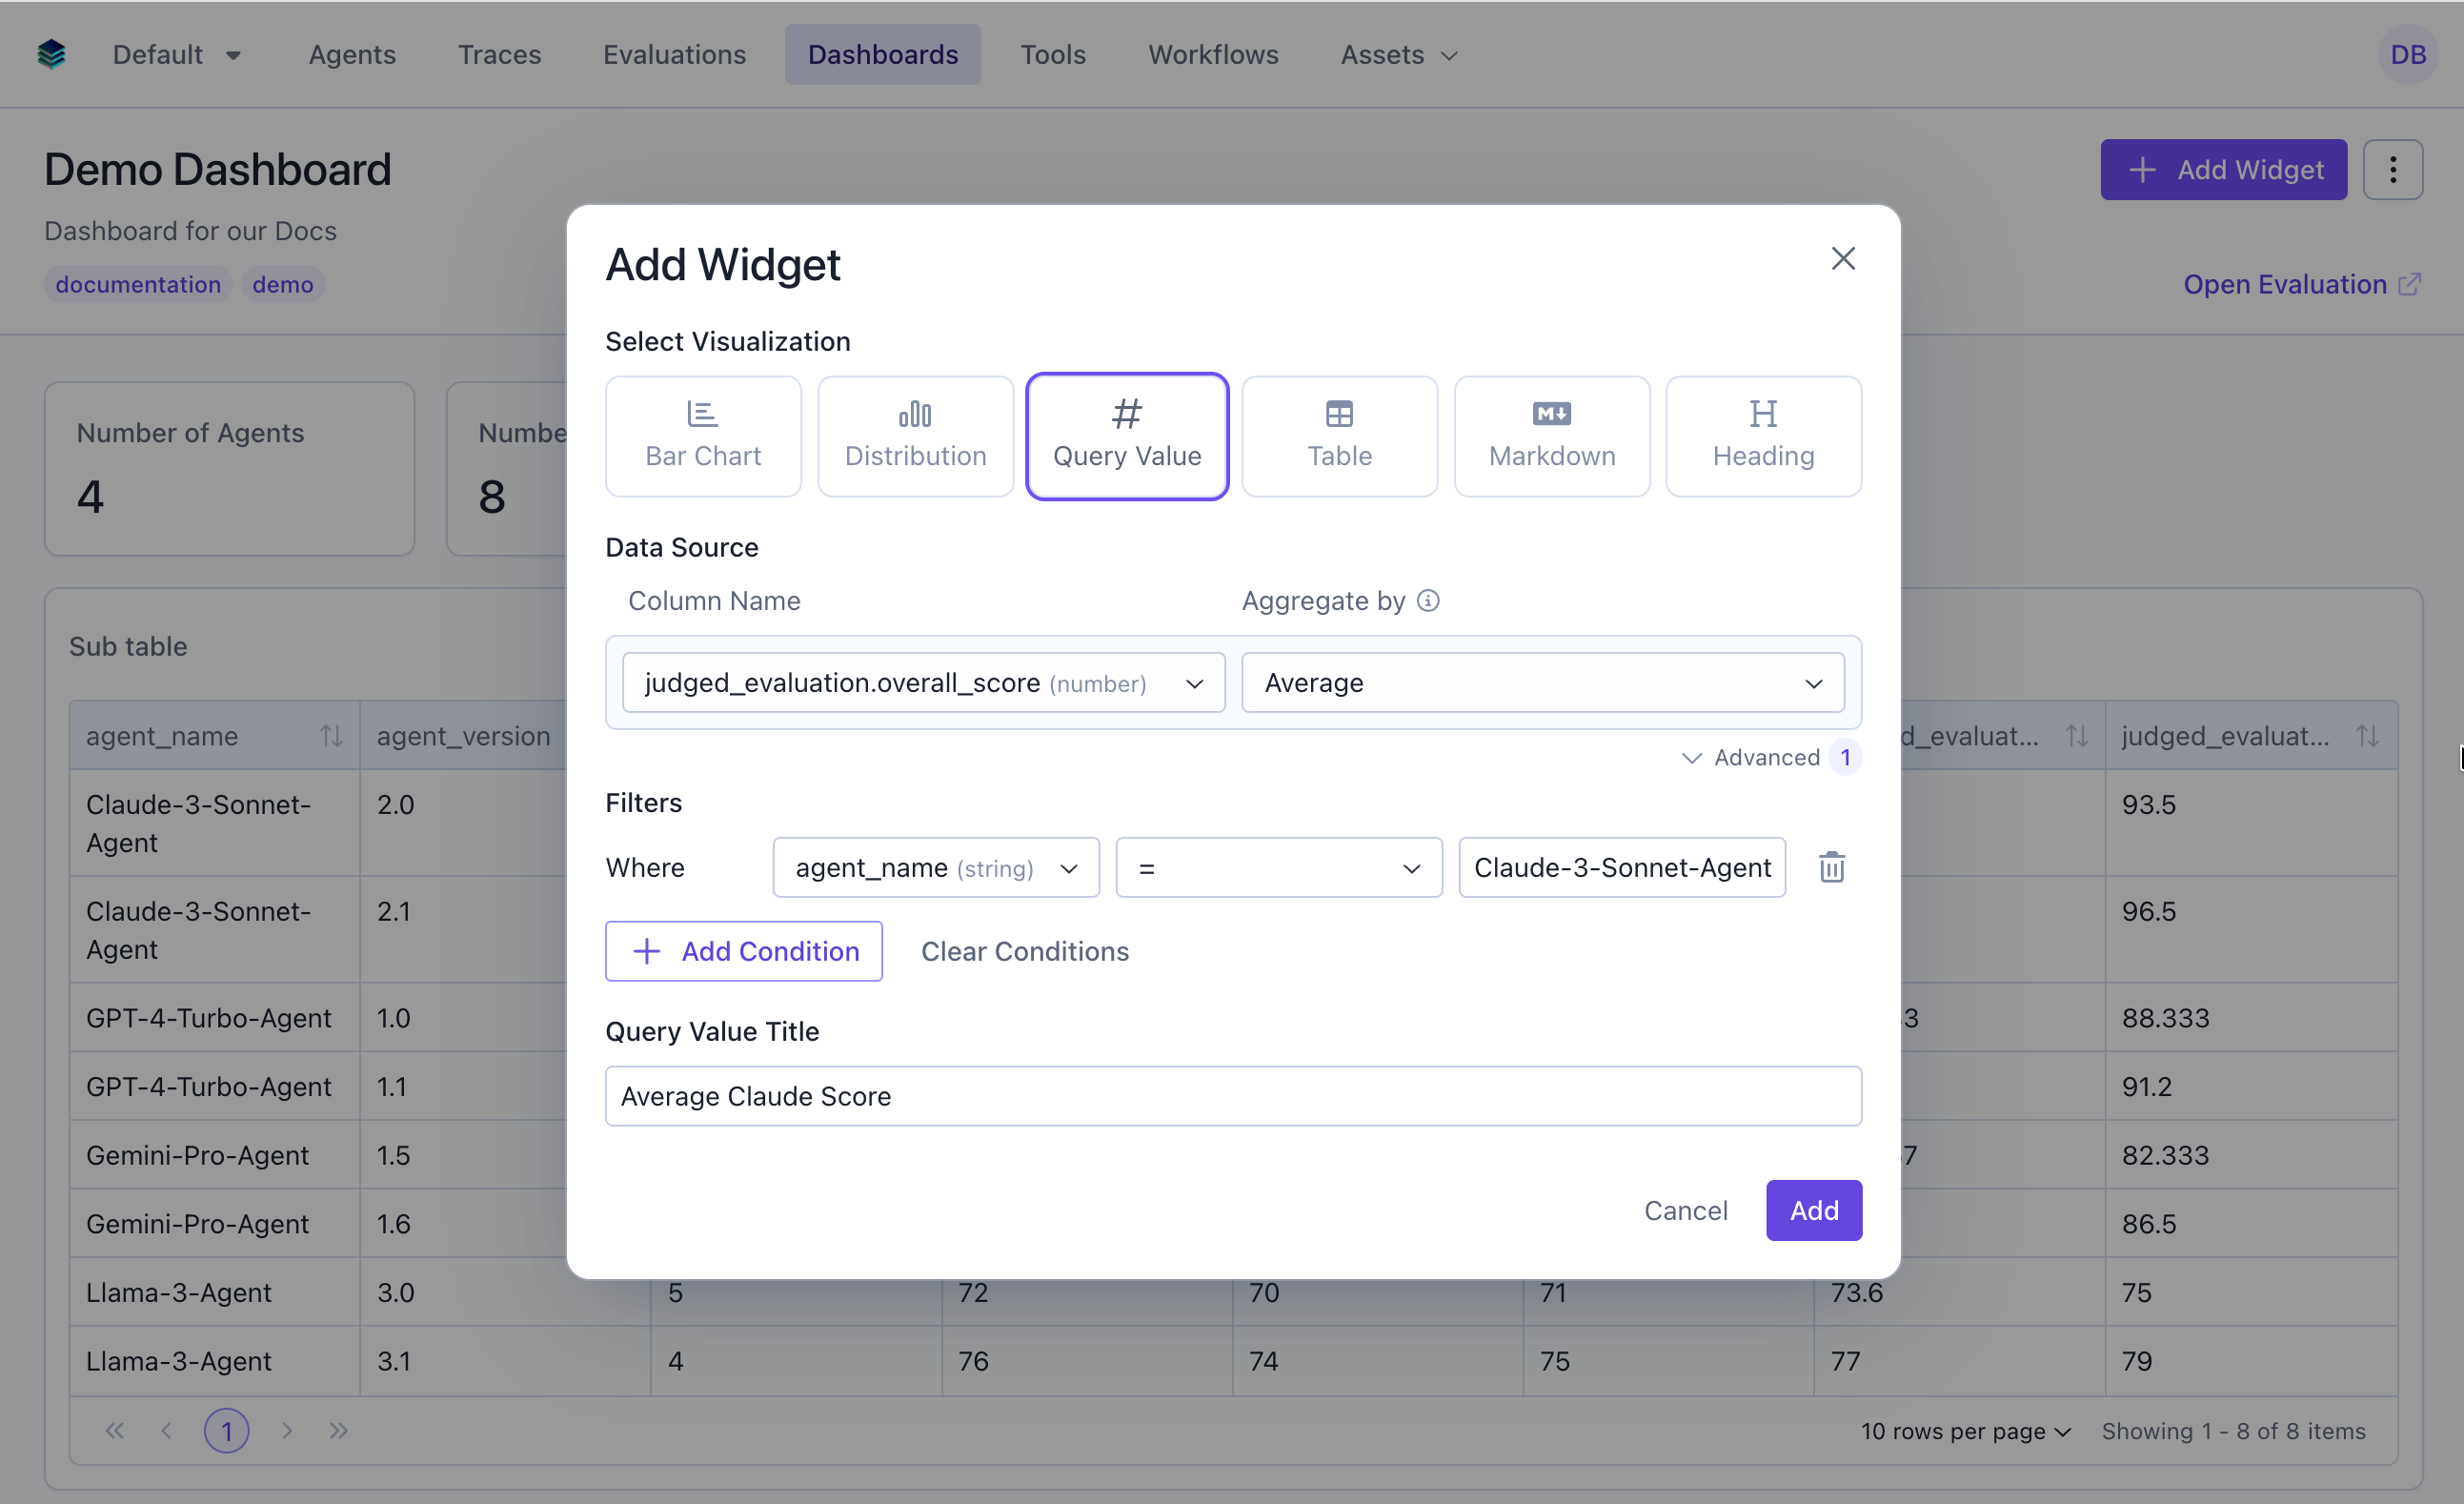
- Column: Select the field to aggregate
- Aggregation: Choose the function
- Filter (optional): Add conditions to narrow the data
Output Format
Metric widgets return a single scalar value:data field contains the computed number, which can be:
- A decimal number (0.873)
- An integer (1247)
- A percentage (0.85 representing 85%)
Example Use Cases
Use Case 1: Average Overall Score
Display the mean overall score across all evaluation items.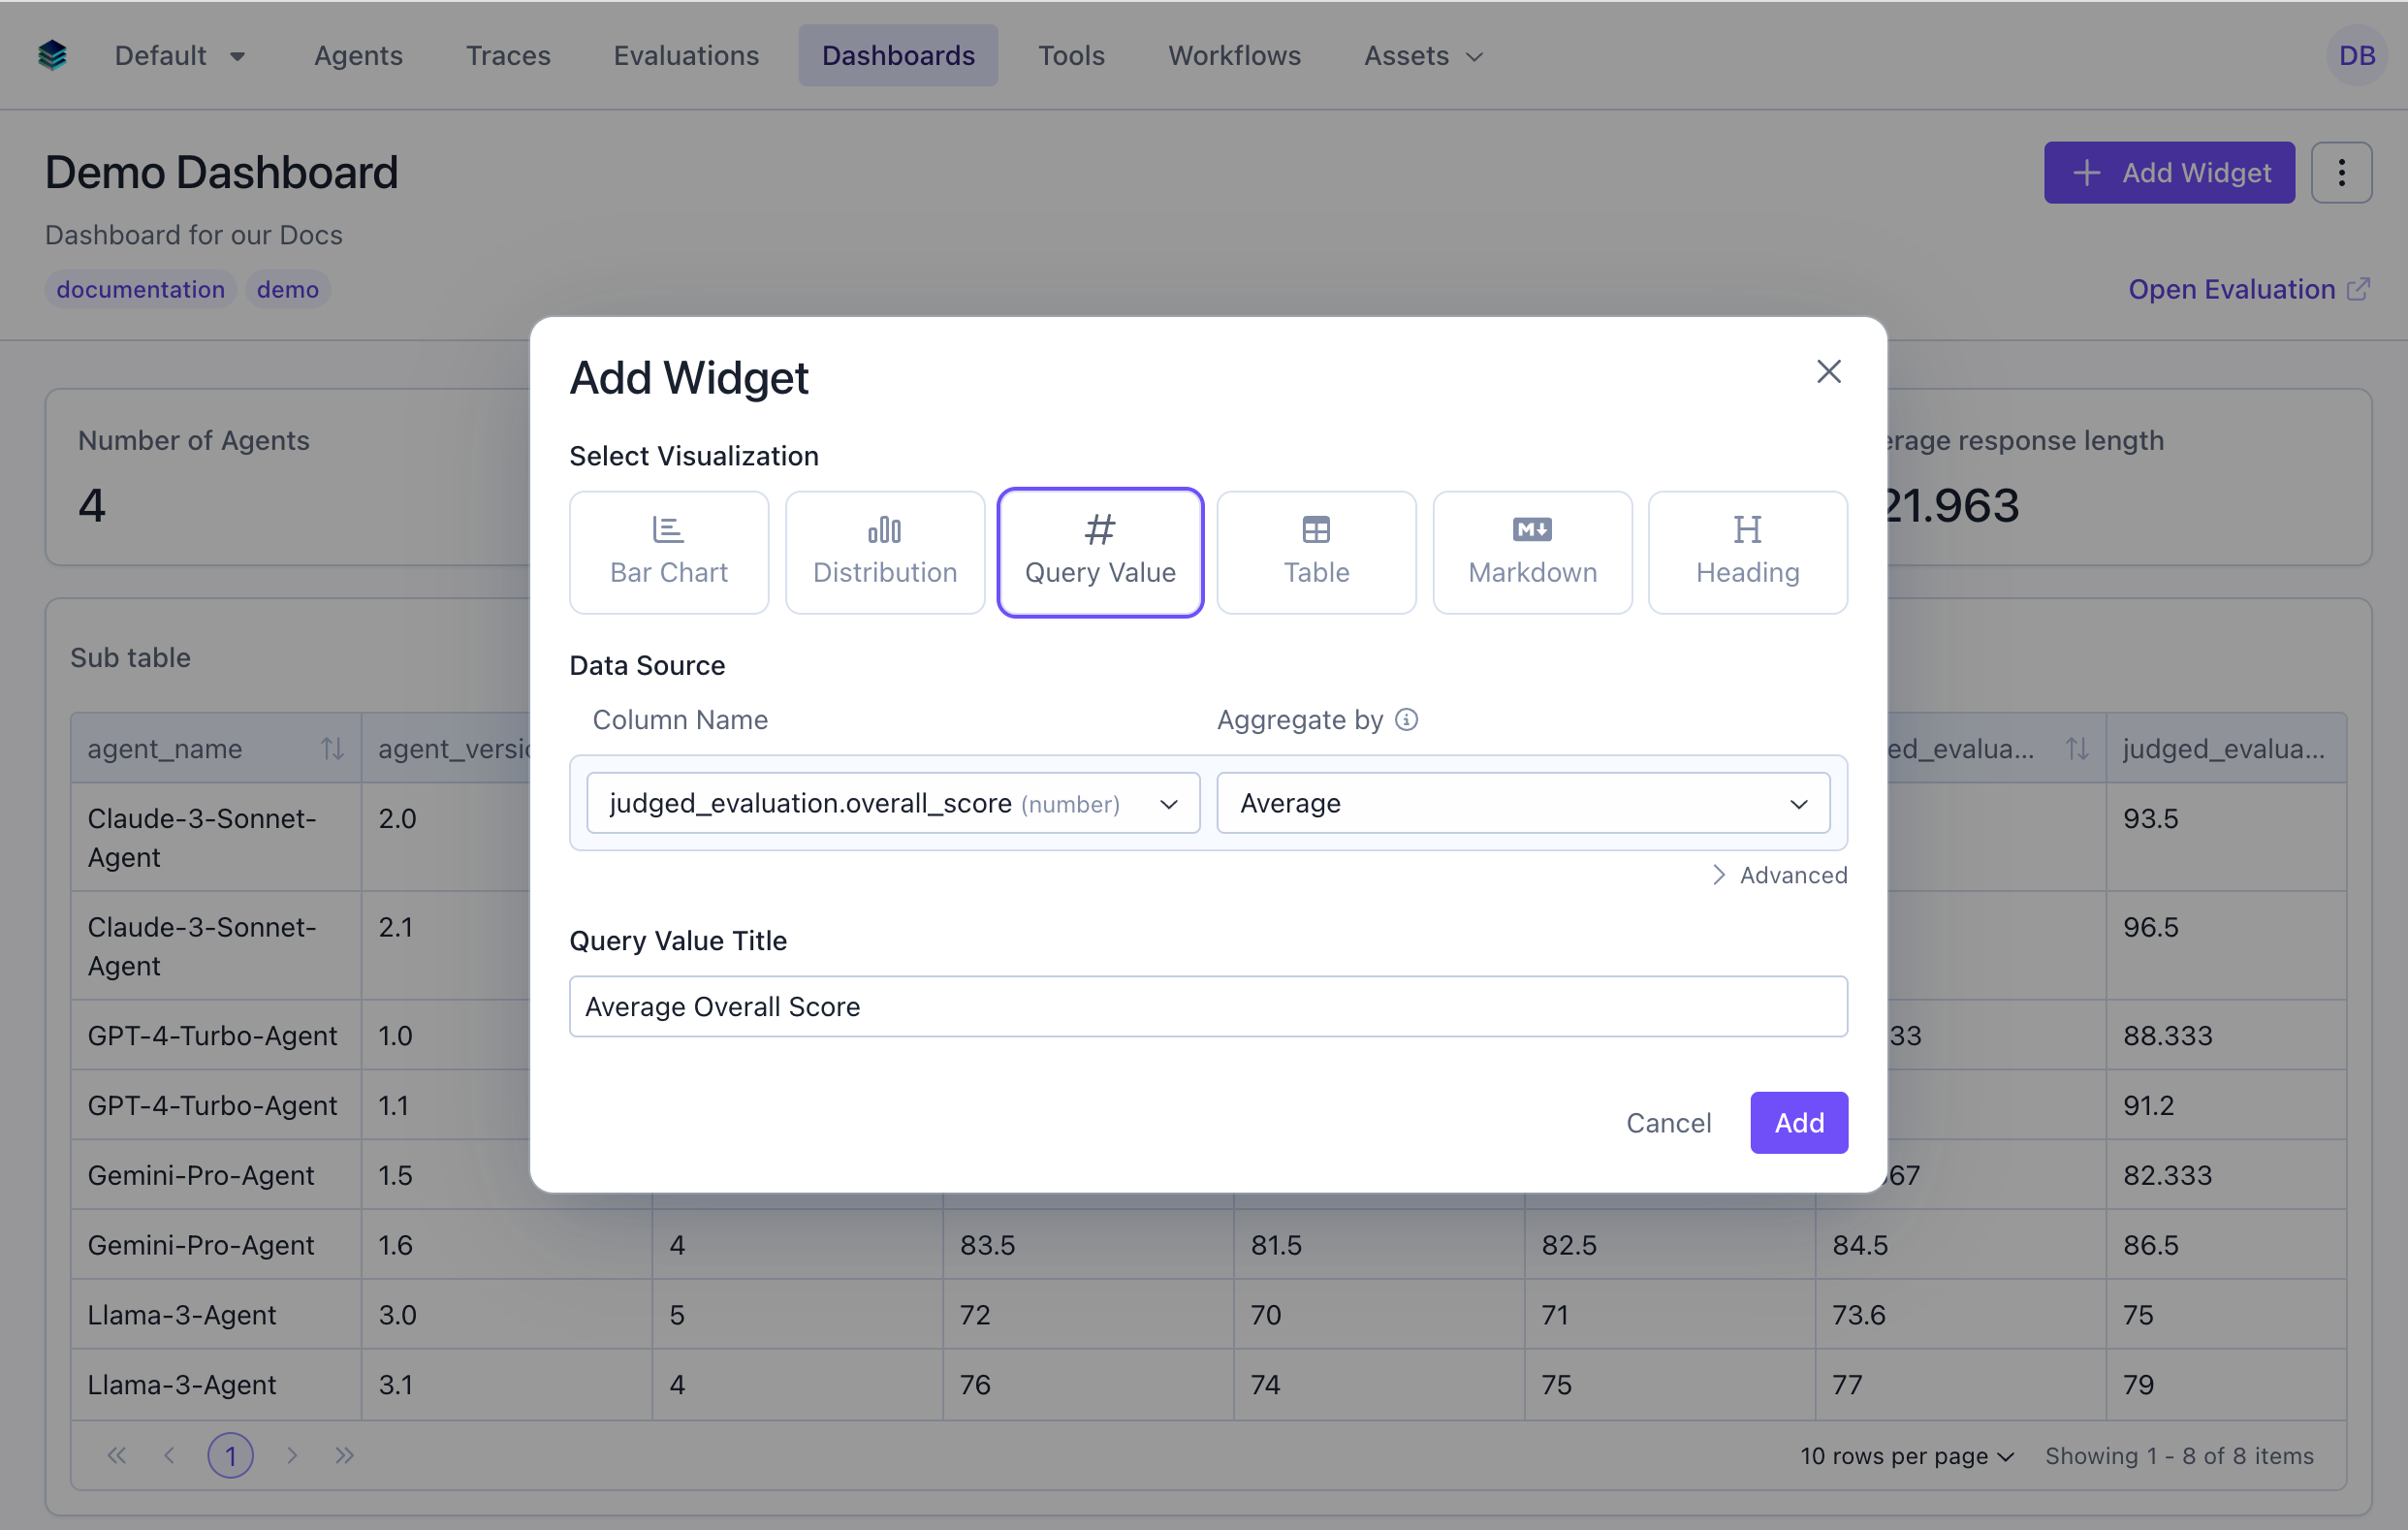
Use Case 2: Total Evaluation Count
Show how many evaluation items are in the dataset.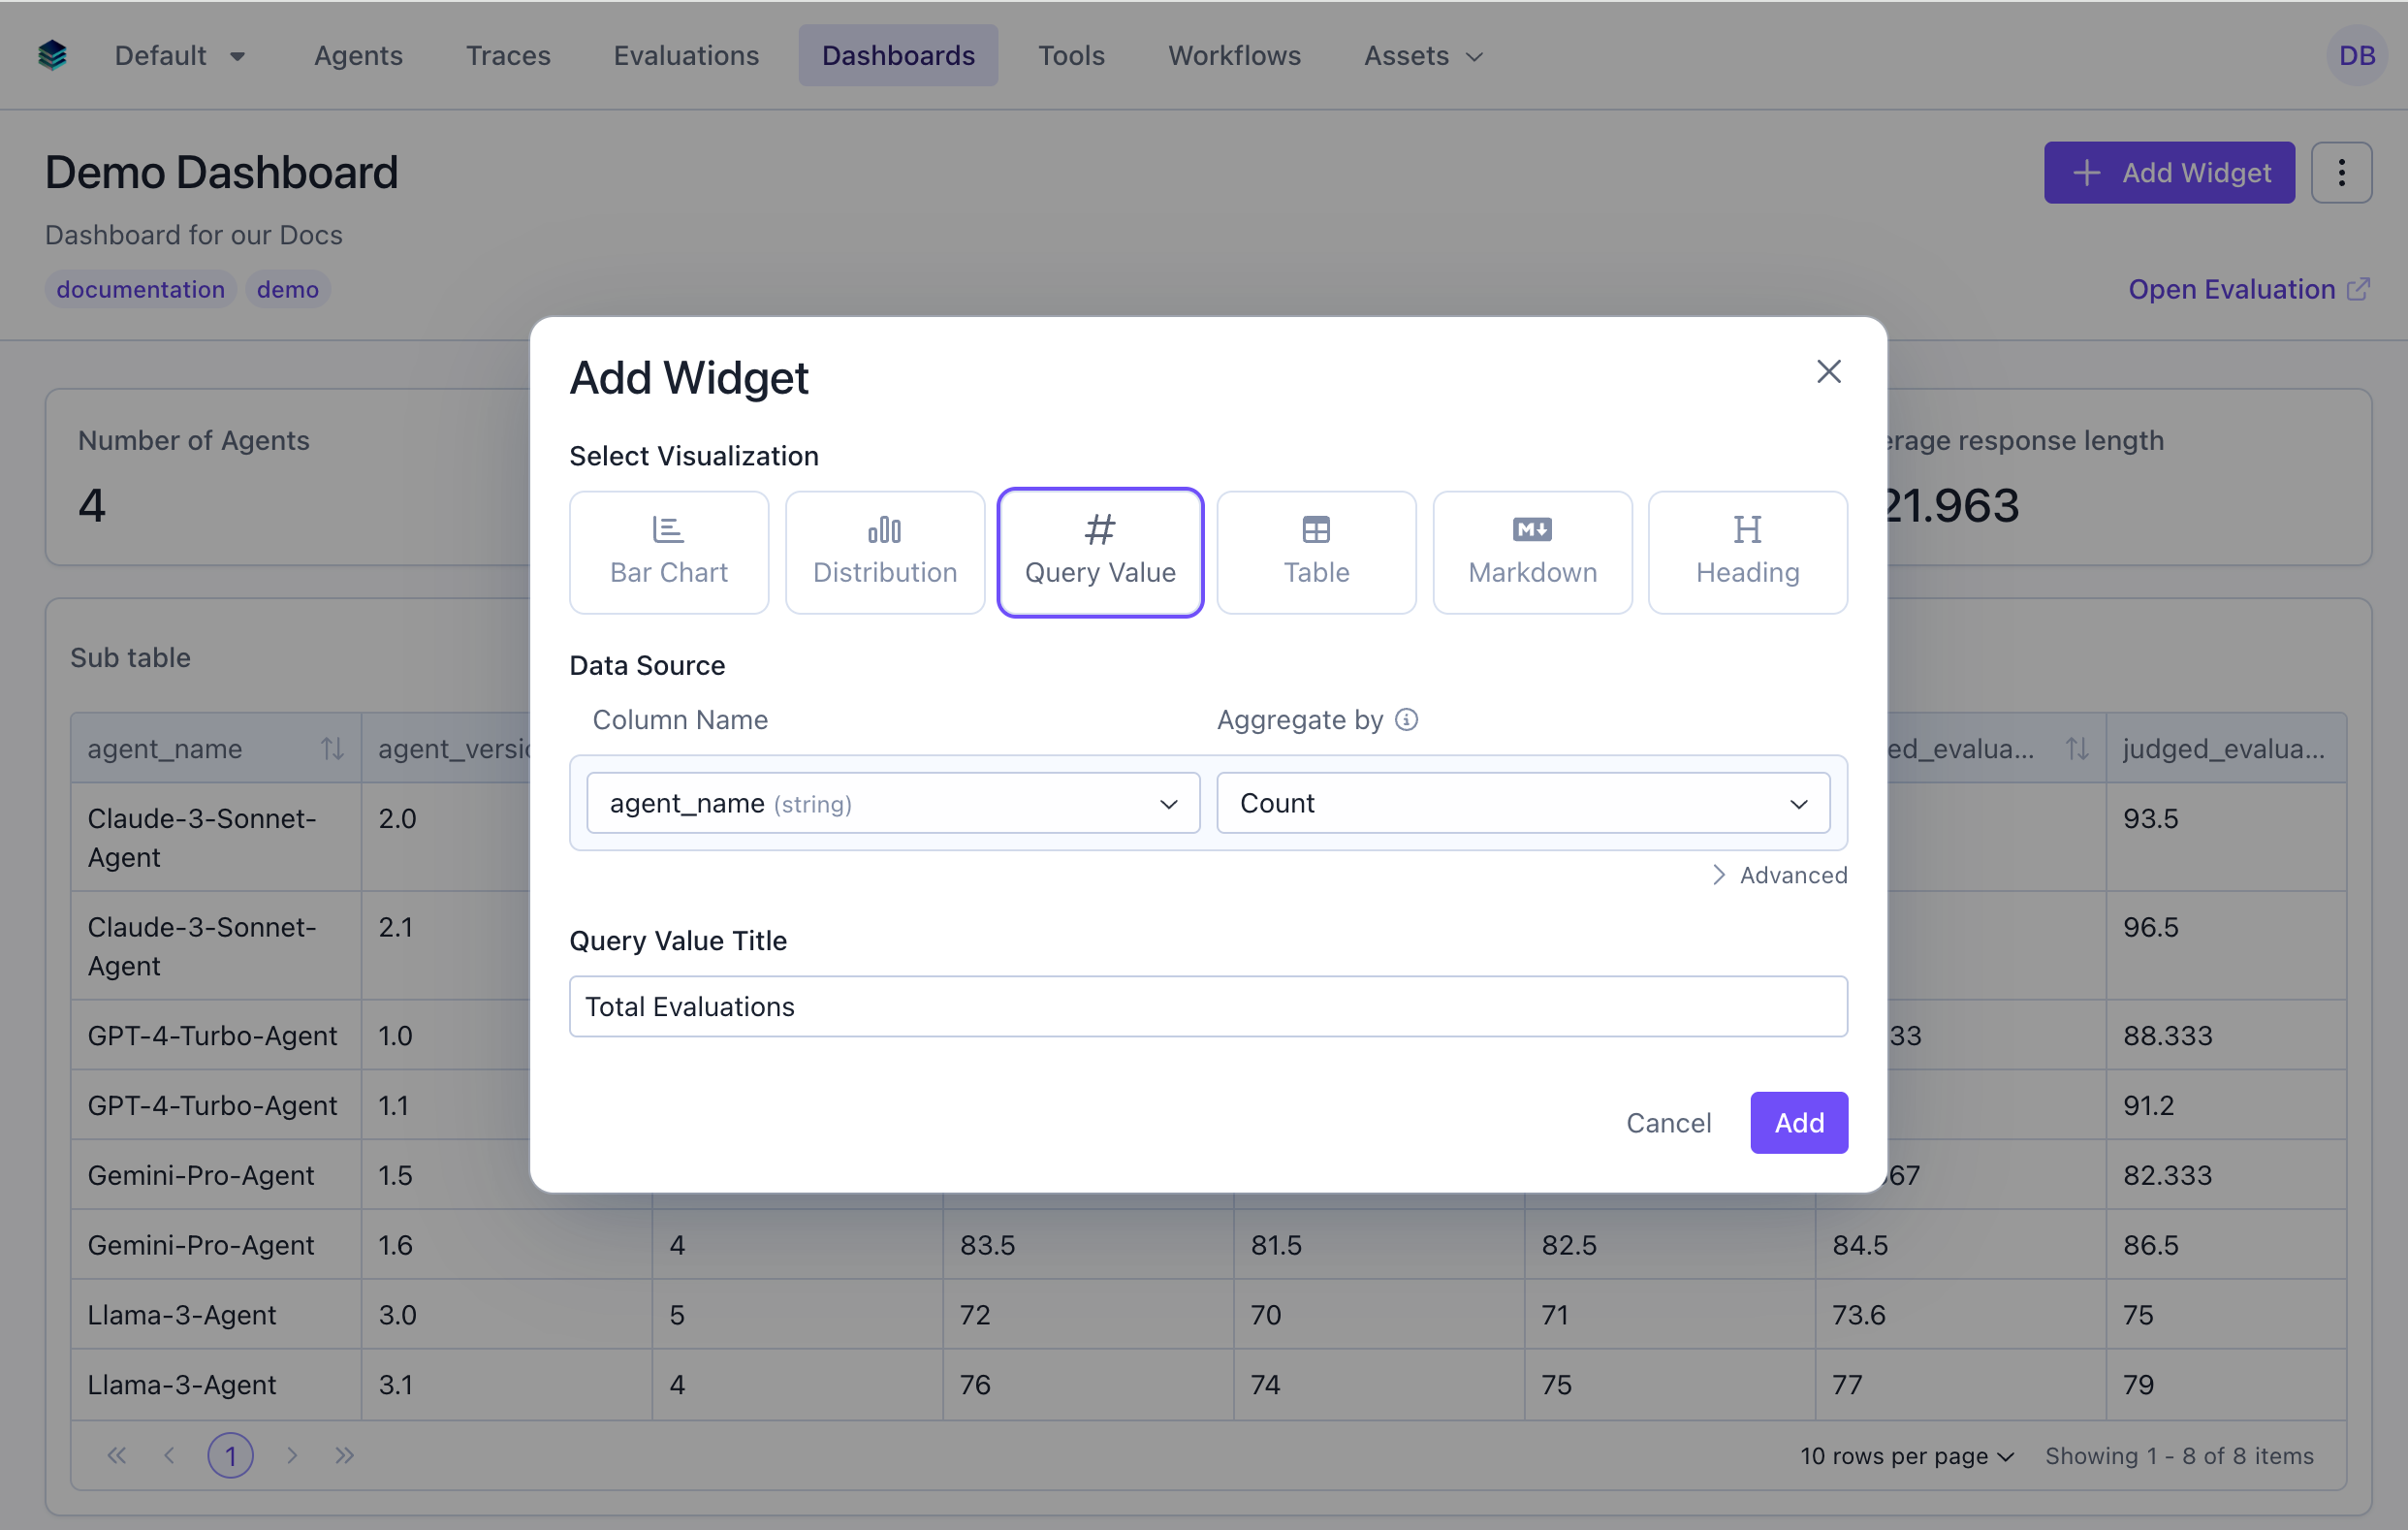
Use Case 3: High Performance Rate
Calculate percentage of evaluations scoring 85 or above.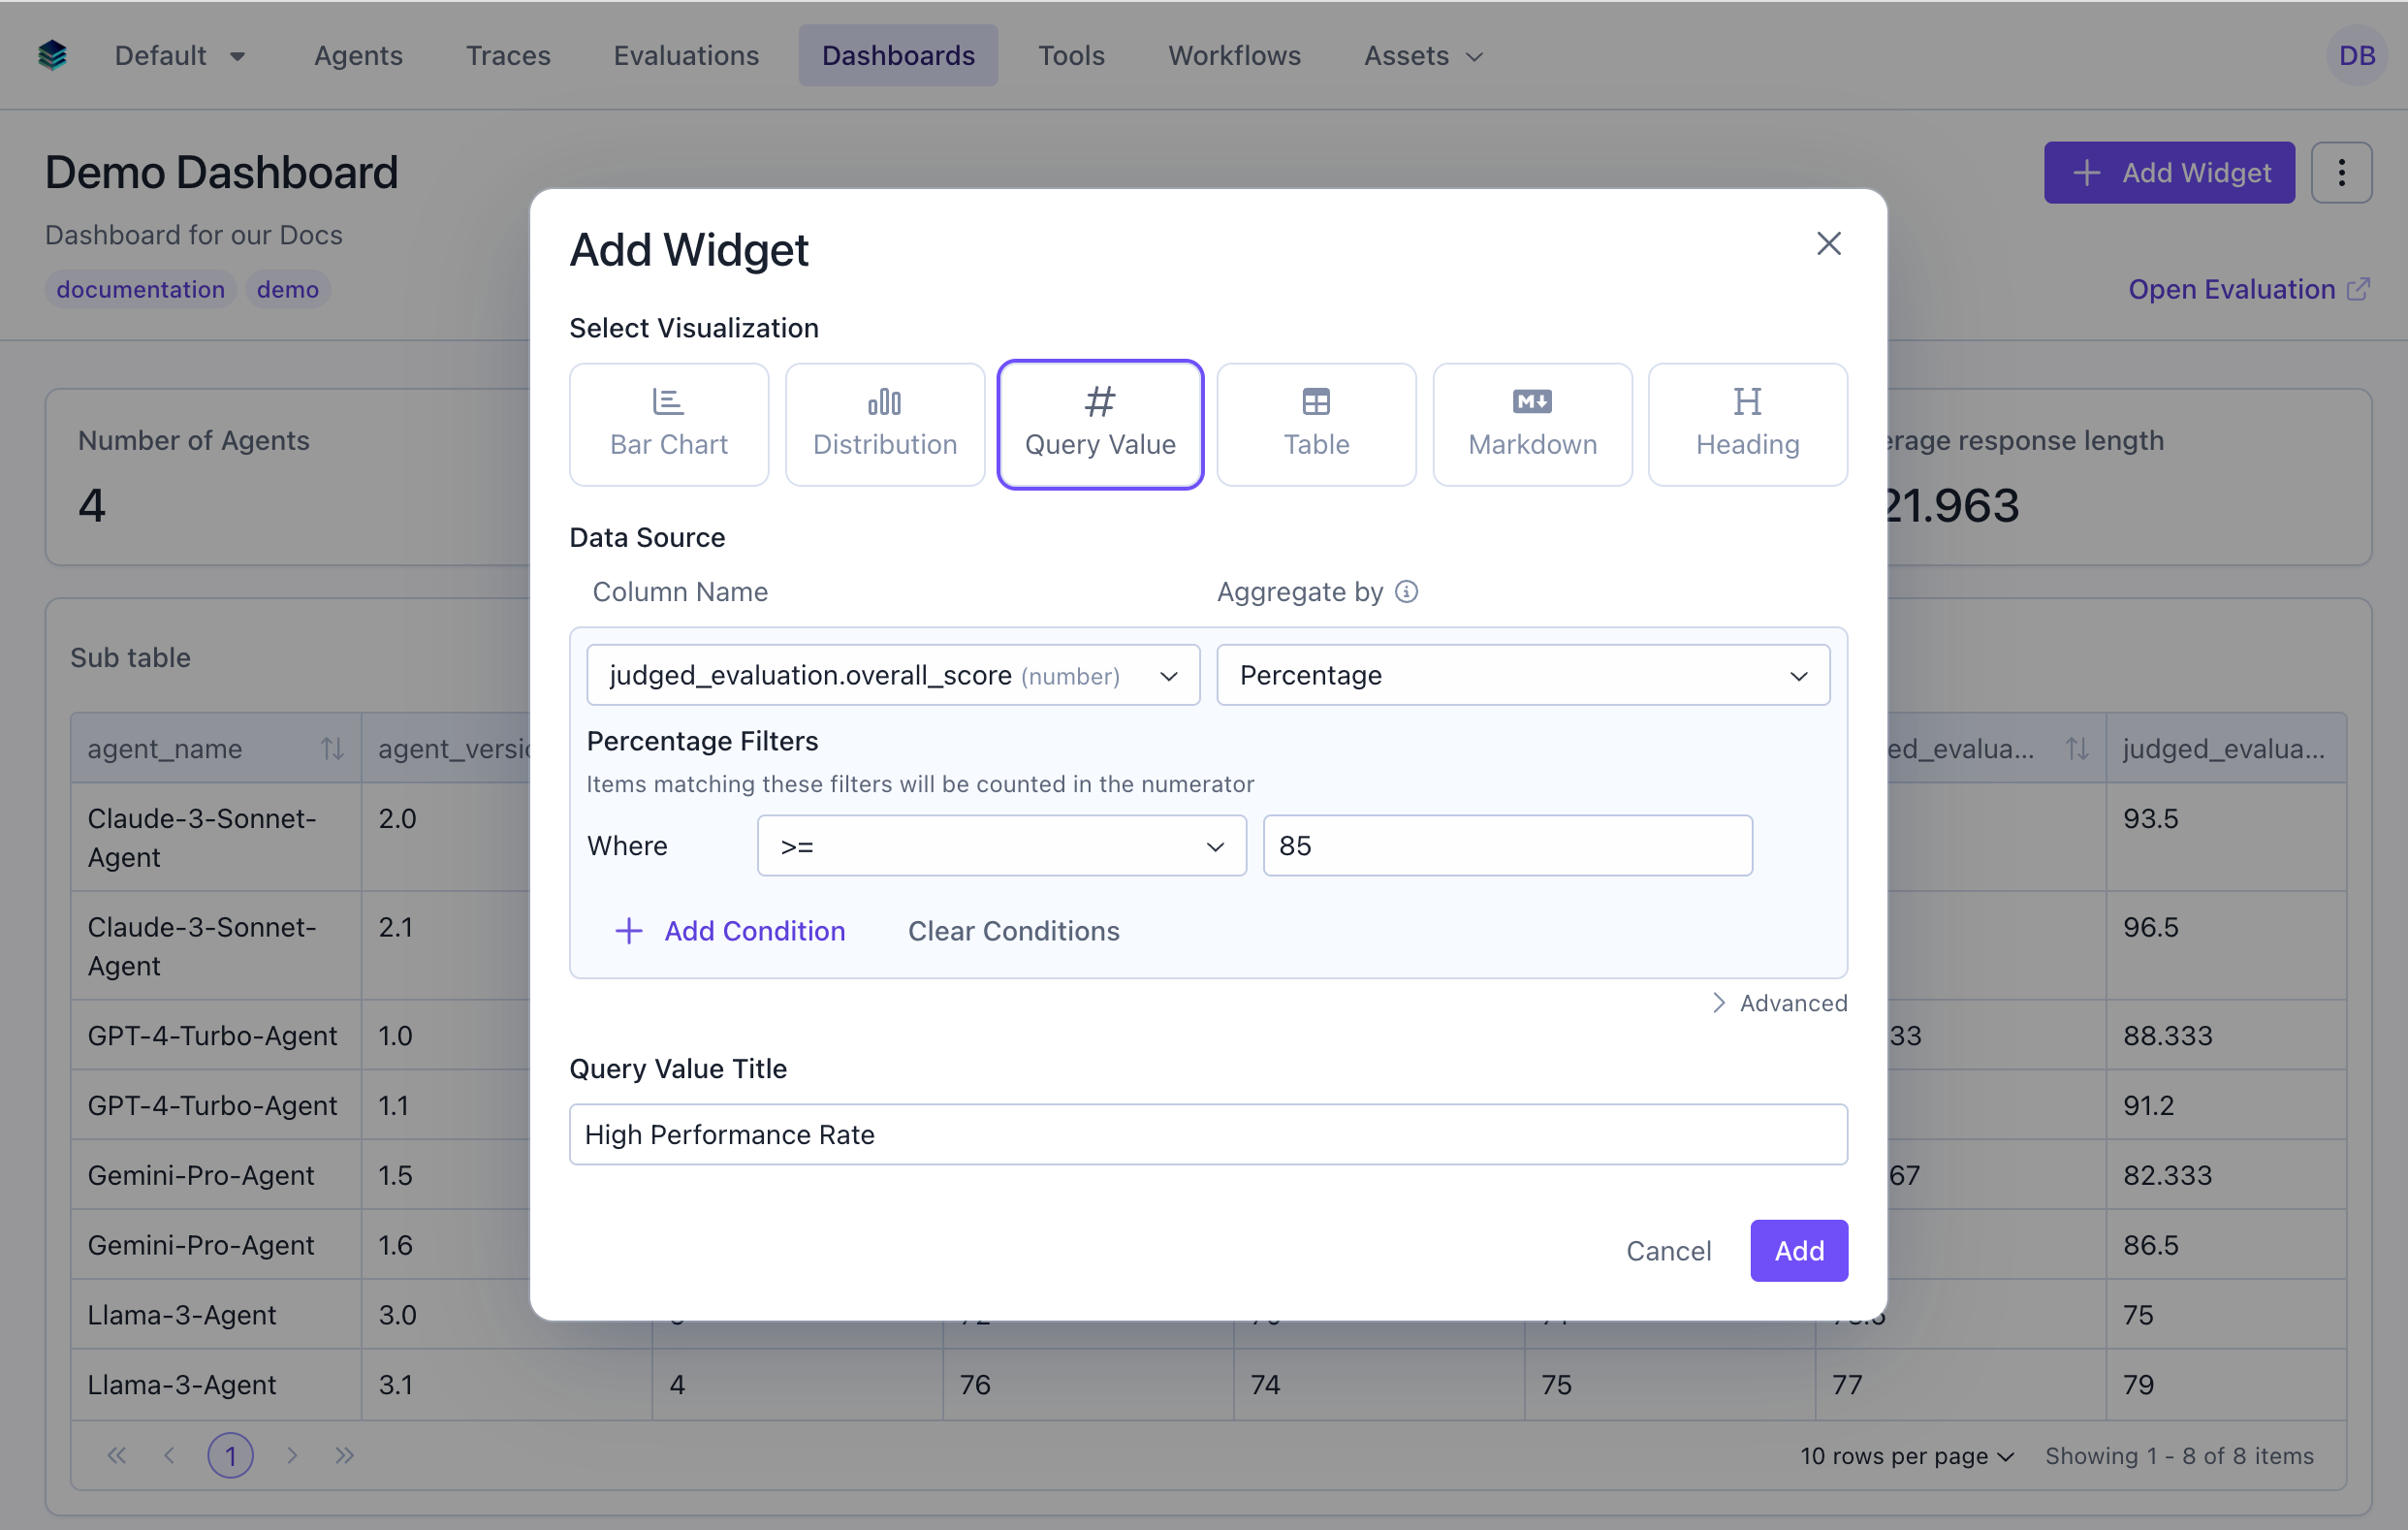
Use Case 4: 95th Percentile Overall Score
Show the 95th percentile to understand top-end performance.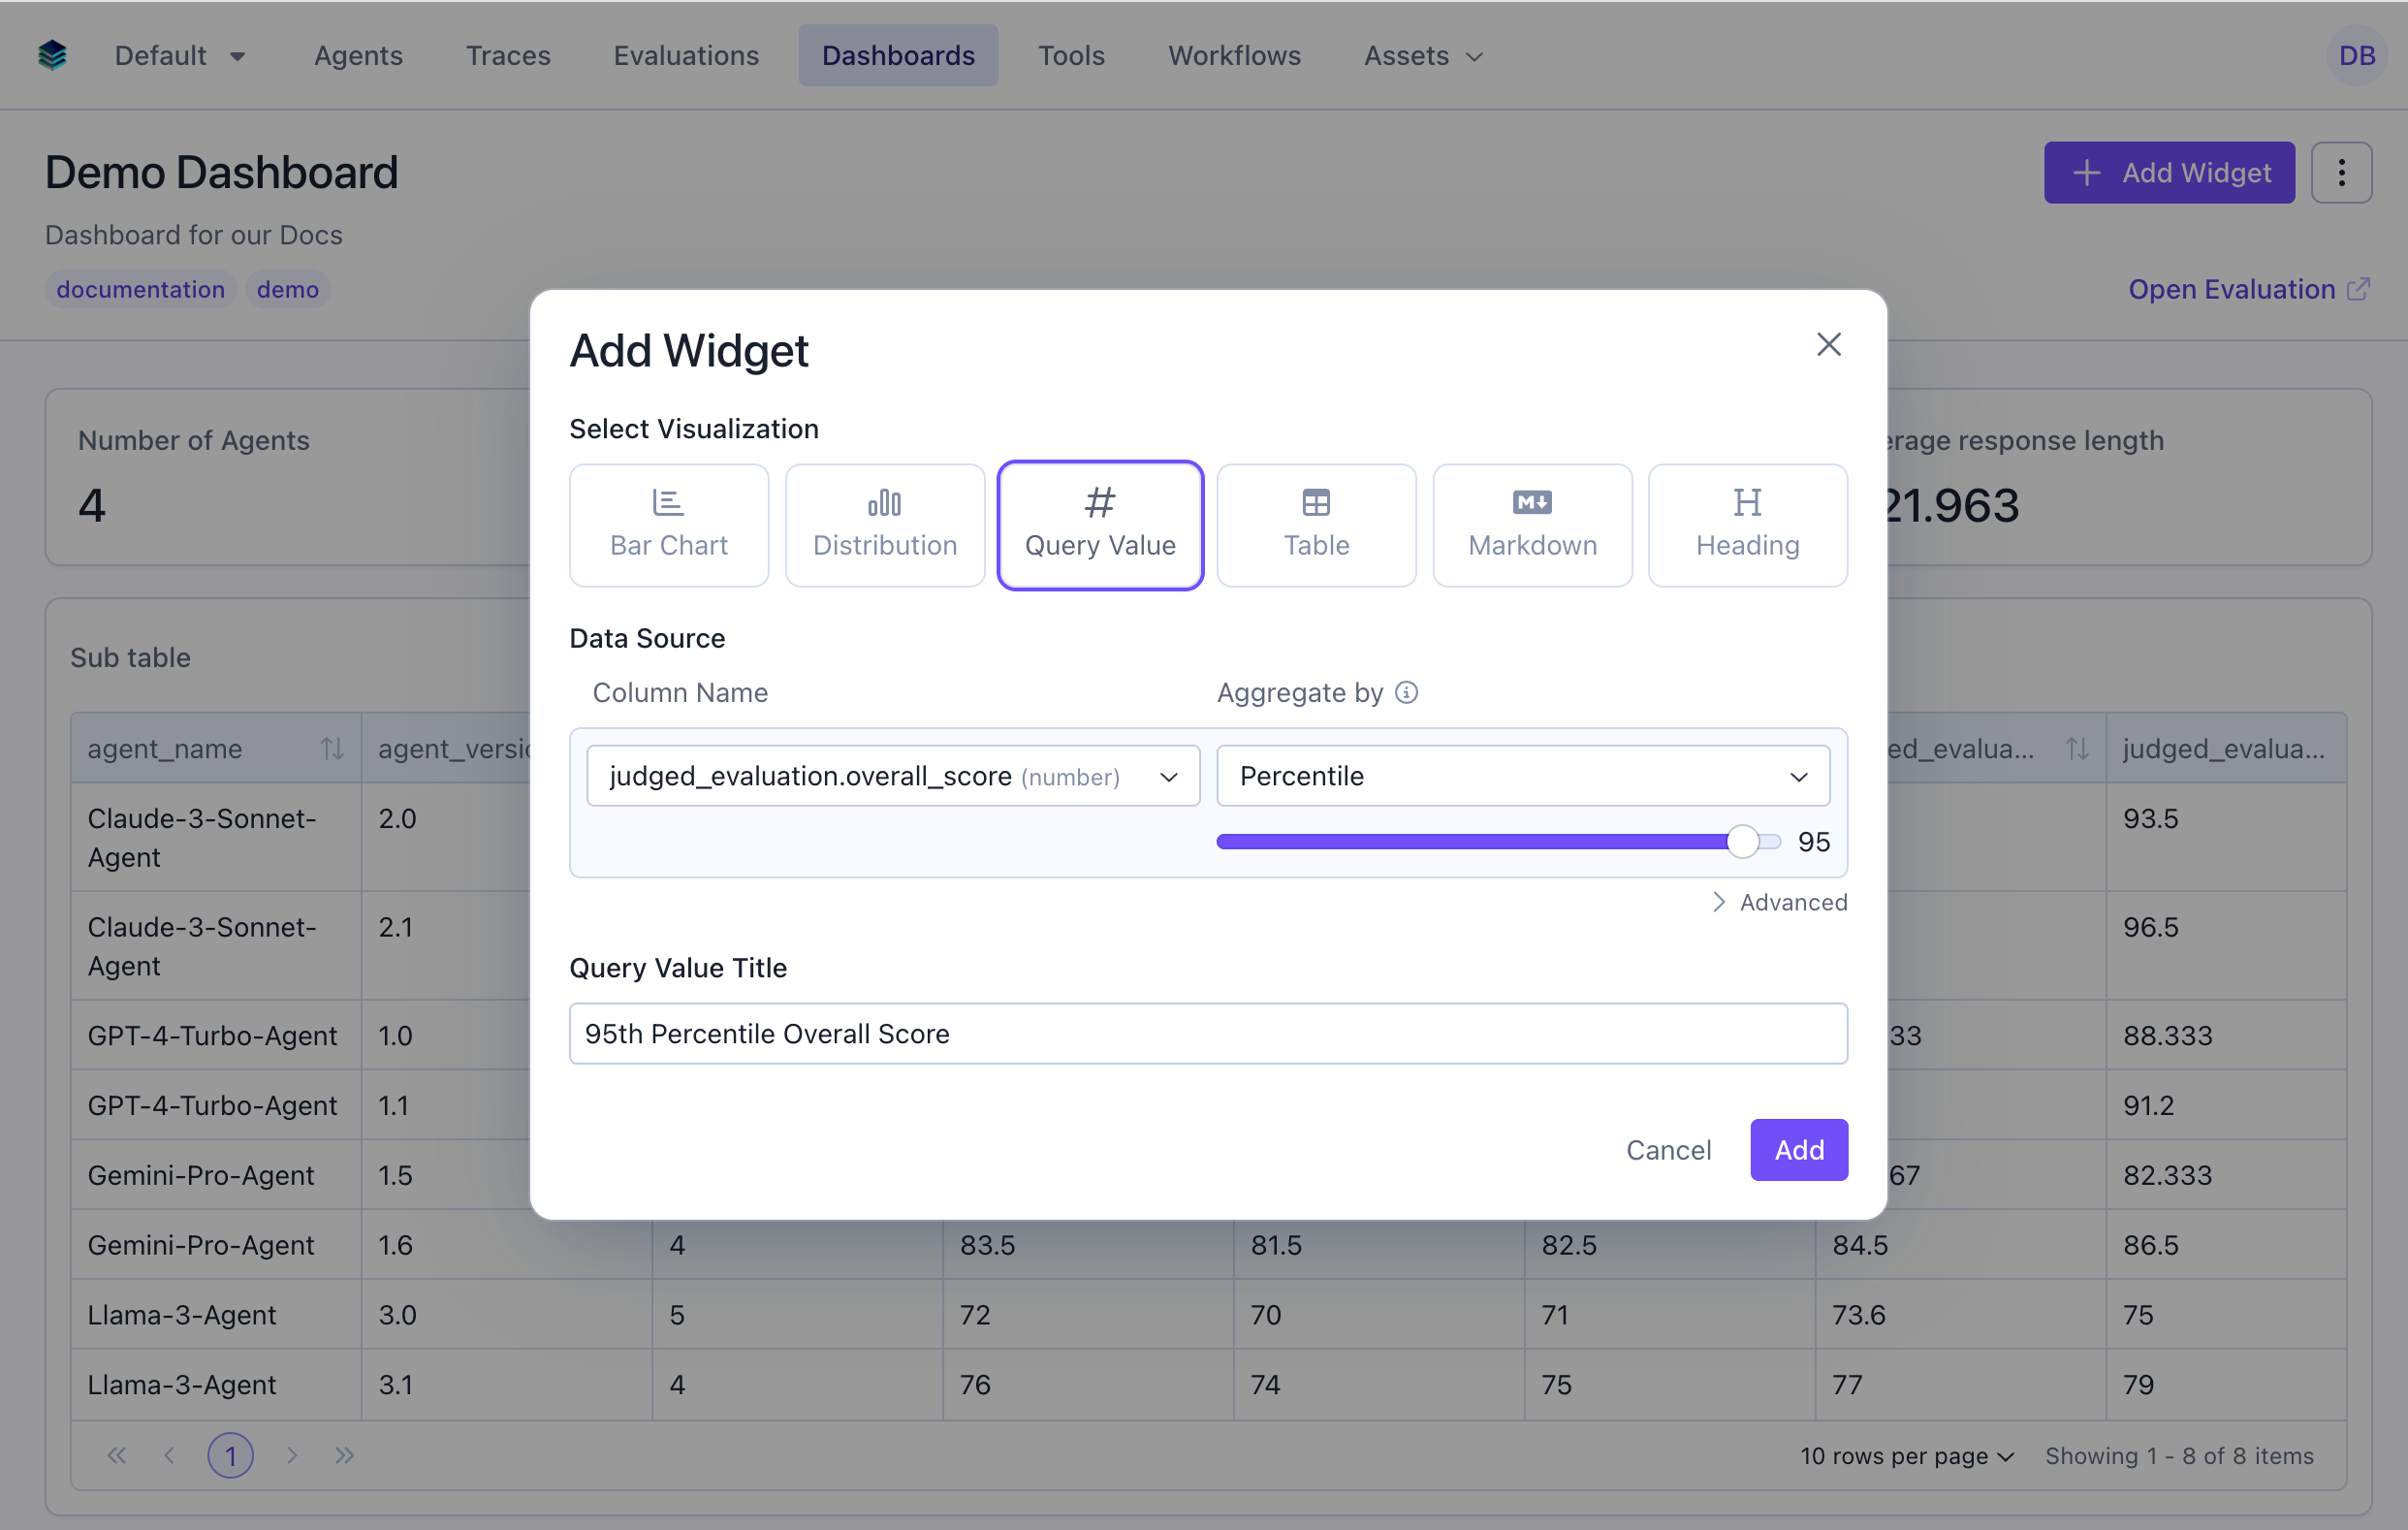
Use Case 5: Average Score for Technical Tasks
Calculate average score for only technical task types.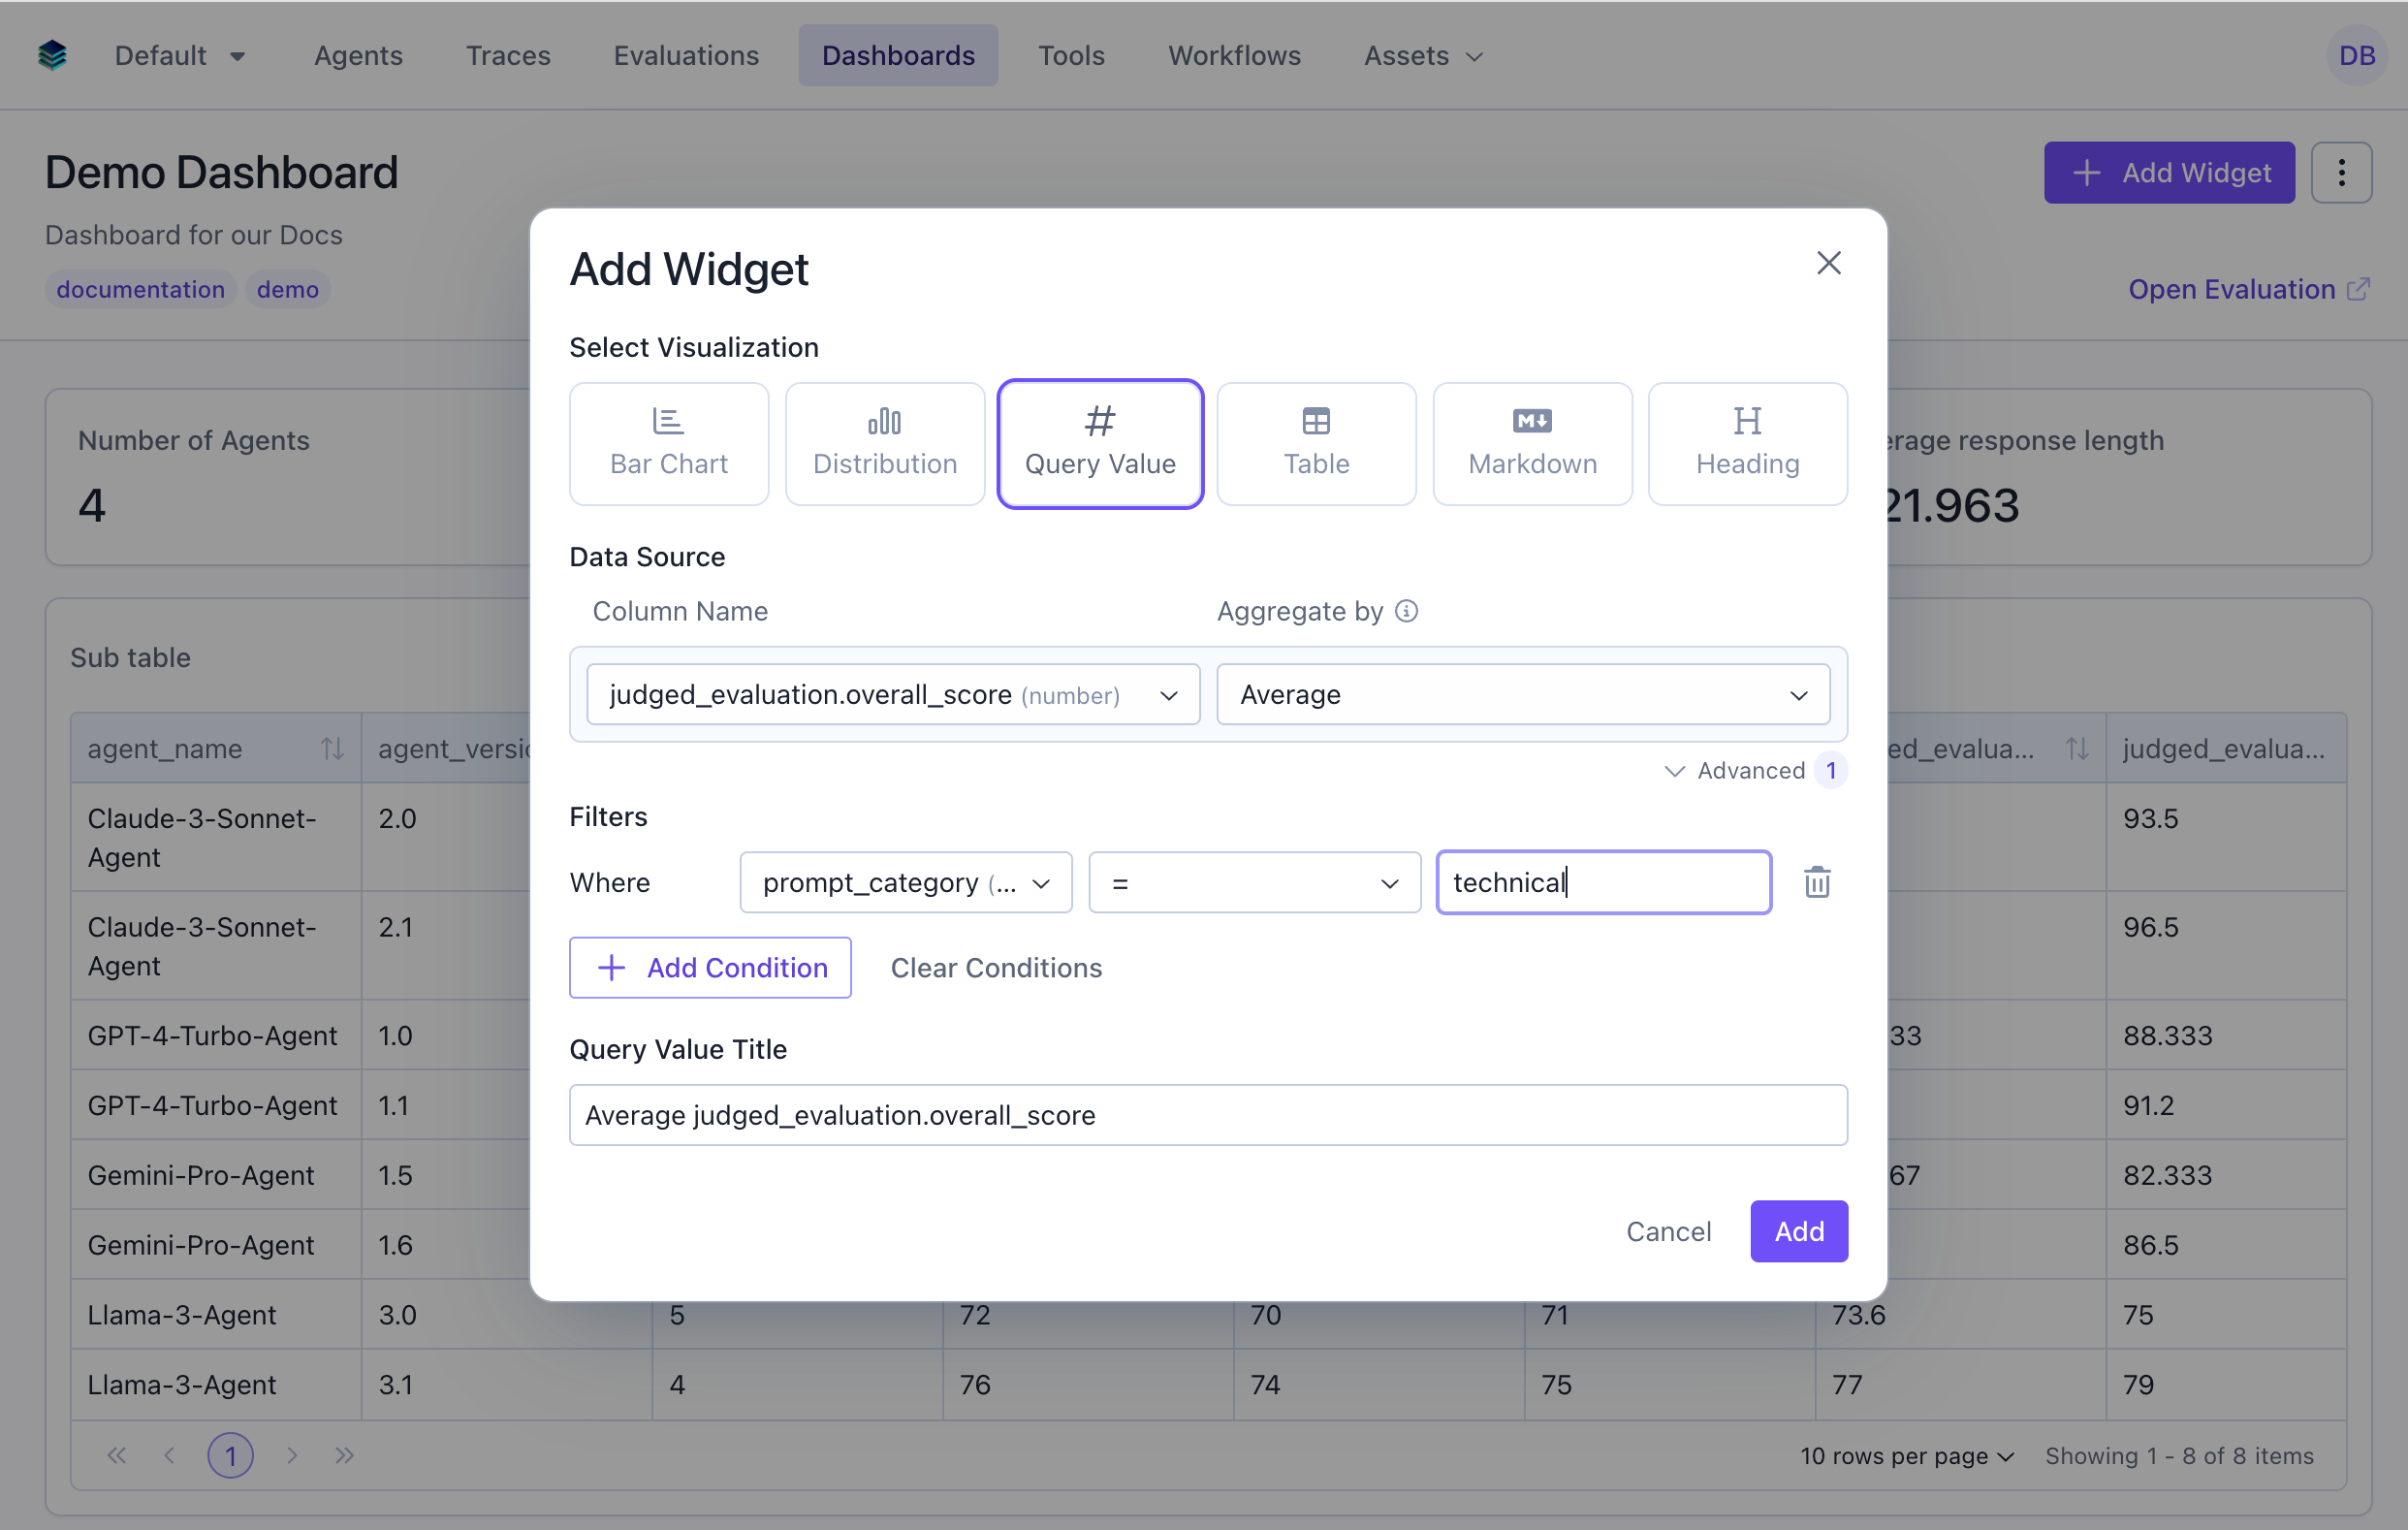
Related Documentation
- Query Language Reference - Full query syntax guide
- All Widget Types - Compare different widget types
- Table Widget - For multi-row displays
- API Reference - Explore programmatic widget creation